Here’s a paper by Frank Fenner (1914-2010), which compares quite a lot of different poxviruses to establish basic facts about their biology.
By 1958, when this was published, Fenner was already well known in Australia for his leadership role in releasing extremely deadly myxoma virus among the rabbit population. This was deemed to be worth the risk, as the creatures had for almost a century been locust-like in their consumption of Australia’s crops, only making themselves useful as a source of food during the Depression. In a prelude to fellow Australian Barry Marshall’s auto-experimentation with Helicobacter pylori, Fenner and two other experts infected themselves with myxoma to show that the risk to humanity was negligible.
Fenner F (1958). The biological characters of several strains of vaccinia, cowpox and rabbitpox virus. Virology 5(3):502-529. (abstract here: subscription required for full article)
This paper was an attempt to clear up the categorization of various poxvirus strains, mostly vaccinia virus. Fenner got colleagues around the world to provide samples of Mill Hill (V-MH), Williamsport (V-WILL), Pasteur Institute (V-PI), and other vaccinia isolates, which had been designated as either “dermal” or “neuro-” vaccinia based on whether they had been propagated in rabbit skin or rabbit brain. Were these categories practically useful? What strains of vaccinia, if any, were really typical of the virus?
The vaccinia strains were compared to the “Amsterdam” and “Brighton” variants of cowpox, and the “Utrecht” and “Rockefeller Institute” variants of rabbitpox. Rabbitpox is not the same as myxoma virus, by the way.
* * *
Also included in the comparison were “white variants” of certain virus strains. At this time culturing cell lines in vitro was not convenient. Lots of procedures, including growing virus, that we would now do with cellular monolayers in petri dishes were done in a system called the chorioallantoic membrane (CAM). The CAM is the membrane under the shell of an egg. Before doing any experiments on the various viruses, Fenner and associates made sure each virus was pure, by inoculating eggs and then extracting a single “pock” from the CAM for further propagation.
Often they would see that a virus that normally produced red, angry pocks had a few white pocks. Under further study, these “white variants” generally turned out to be milder than their parent strains, as a result of some genetic deletion. The white variants gave me some trouble in putting together the graphs based on Fenner’s data, because they are grouped with non-white strains that are far more virulent.
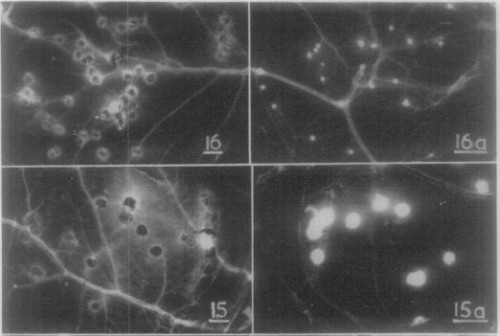
Sample chorioallantoic membrane pocks. 16a is the “white variant” of 16 (Rabbitpox Utrecht). 15a is the “white variant” of 15 (Cowpox Brighton).
Let’s get to the data. After doing a bunch of CAM experiments, Fenner started infecting animals. He compared the viruses for their ability to kill mice and rabbits after brain infection, and induce skin lesions in rabbits after skin infection.
This table contains an immense amount of data, but it takes up two pages which is never a good thing. I think we can turn it into two good figures, one for mouse infection and one for rabbit infection.

First of all, not all this data needs to be graphed. If you look at the last two columns, every rabbit skin lesion of more than 13 mm in diameter is considered “IPC”, and every smaller lesion is “N”. That’s all we need to know. Also, I don’t think it makes sense to list a mean survival time for experiments where almost every mouse survived. It’s a little sketchy to say that mice that never came close to dying had a “survival time” of 14 days, and then average that arbitrary number with actual survival times of mice that died. So I’ll drop the “mean survival time” data as well.
* * *
My mouse figure has two parts. I didn’t do any statistics on the data.
1A shows the relative virulence, which is a somewhat confusing metric that compares the LD50 (dose of virus at which half of infected animals die) with the virus’s ability to cause pocks on the egg membrane. All of the viruses grow pretty well in eggs, so this shows which viruses are particularly adapted to be dangerous to mice (or rabbits).
1B shows how many mice survived brain infection with each virus strain. Nowadays we would show survival curves for this – you know, the lines that always start out horizontal with 100% survival, and as the experiment goes on, the line goes down and down, stepwise, as mice succumb to mortality. But Fenner just shows the percent of mice that died during infection (probably this means the number that were dead after 14 days). I changed this to become a graph that shows the % of mice that survived infection.

Figure 1. Mice are more susceptible to neurovaccinia and rabbitpox than dermal vaccinia. (A) For each strain of virus, mice were infected intracranially with a range of doses, and the LD50 was calculated as the dose which was lethal to 50% of infected mice. LD50 values are normalized to the number of CAM pocks produced by the same dose of virus in eggs. Horizontal line represents the limit of detection. (B) For each strain of virus, mice were infected intracranially with 100,000 infectious particles. Here we show the percent of mice surviving to 14 days post-infection (sample size = 10). Bars with white stars represent “white variants”.
The rabbit figure has three parts.
2A is the relative virulence data again. This time it’s not the LD50, but the ID50. (Even though it says “LD50” in Fenner’s table, it says “ID50” in the legend and in the text.) “LD” means lethal dose, whereas “ID” means infectious dose. So this is the dose of virus at which half of infected animals show signs of infection. “Infection” in this case would be a skin lesion. He doesn’t say exactly how big a lesion needs to be before it’s considered “infection”.
2B is a similar graph showing the diameter of the lesions, in millimeters.
And then there’s a bunch of survival curves. 2D is too busy to be able to decipher each datapoint, with eight overlapping lines in a single graph, but what’s important is that there’s a huge difference between 2C and 2D.
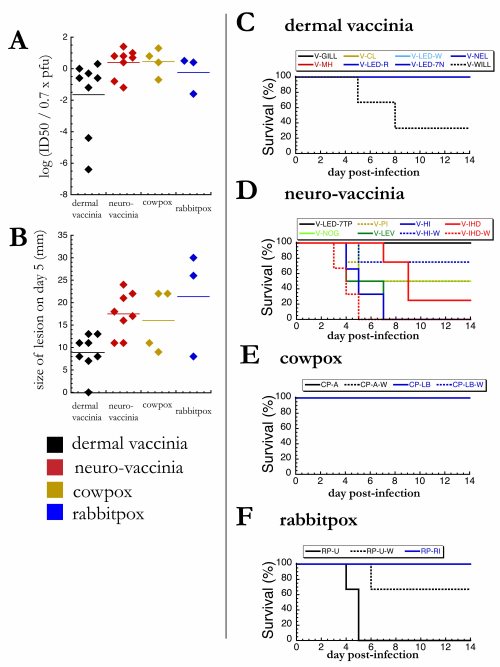
Figure 2. Rabbits are more susceptible to neurovaccinia and rabbitpox than dermal vaccinia. (A) For each strain of virus, rabbits were infected intradermally with a range of doses, and the ID50 was calculated as the dose which produced a lesion in 50% of infected mice. ID50 values are normalized as described in 1A. (B) For each strain of virus, rabbits were infected intradermally with 100,000 infectious particles. After 5 days of infection, the diameter of each skin lesion was measured with a ruler. (C-F) For each strain of virus, rabbits were infected intradermally with 100,000 infectious particles, and survival was monitored daily (sample size = 2-4).
What do you think? Let me know through email (see “About” page). Or through Twitter. Or subscribe via email or RSS (see bottom of this page). Or watch this German rap video.