
Data update: How dyestuffs make stuff die

This year, antibiotic researcher Mark Wainwright published a “Discussion” in the International Journal of Antimicrobial Agents, suggesting that we should take another look at a subject that he works on but most scientists lost interest in 6 decades ago: highly toxic synthetic molecules that can be used as local antiseptics and have distinctive bright coloration. What he calls “photoantimicrobials” represent a subset (those that can be targeted more precisely, because they are activated by light) of therapeutic molecules that earlier generations simply called flavines, anilins, or “dyes”.
Browning introduced the application of the basic dyes named above [acriflavine, crystal violet and brilliant green] to battlefield wounds in 1914/15. The aim was always to achieve antisepsis and healthy wound closure, and the approach was also used in pre-operative sterilisation. The dyes used thus represent local antiseptics. Importantly, however, they were an improvement on the available hypochlorite solutions owing to the fact that they were not inactivated by fluids associated with wounds, such as serum. Fleming’s rebuttal of this work, noted above, was based purely on laboratory measurement. However, the disinfection of real wounds and the concomitant recovery of patients could hardly be argued against.
…
By far the majority of clinical work involving dyes was carried out before 1945. At this juncture, the penicillins and other antibiotics or natural product-derived antibacterial agents became the driving force in infectious diseases therapy. From the distance of the early 21st century, it is apparent that these wonder drugs have not been used correctly and that their overuse has allowed a much more rapid development of resistance mechanisms than might otherwise have been the case.
…
In terms of modern healthcare, dye therapy might be considered obsolete and ineffective, and this would indeed be the case if the performance criteria were still the same as in Browning’s day. However, recent research has developed a different approach, one that uses locally applied dyes in conjunction with light to provide a microbial killing effect. Such dyes may be referred to as photodyes or, more properly, photosensitisers. Given their remarkable utility in the field under discussion, they are commonly called photoantimicrobials.
The photoantimicrobial effect has been known in the laboratory since the turn of the last century, but has only been investigated realistically since the early 1990s and is currently proposed foruse in oral and ENT (ear, nose and throat) disinfection. Its remarkable activity lies in the in situ production of reactive oxygen species (ROS) on illumination. The highly reactive nature of species such as singlet oxygen, the hydroxyl radical and the superoxide anion ensures rapid oxidative damage to simple cells, sufficient to guarantee cell death. More importantly, there are no known microbial resistance mechanisms able to combat ROS produced in this way.
…
Furthermore, among the lead compounds used in photo antimicrobial discovery are the same dyes used by Ehrlich and Browning; methylene blue, crystal violet and acriflavine.
Brilliantly colored solutions for treating localized infections and washing out wounds may be making a comeback. And not just to treat pets, for which acriflavine, for example, is now used. In preparation for that retro craze, let’s look at some of the original pre-Depression research. 
Most of it is in German, which I will ignore.
Much of the non-German work on “dye therapy” was led by urologic surgeon John W. Churchman of Yale University. At the top of this post is a rare color photo of bacteria in a Petri dish from the time when Julius Richard Petri (1852-1921) was still alive. This comes from a 1913 Journal of Experimental Medicine paper by Churchman, The Selective Bactericidal Actions of Stains Closely Allied to Gentian Violet, whose figures are otherwise black & white. Even the limitless moneybags of Old Elihu and the Rockefeller Institute only extended to printing one color figure.
* * *
Churchman’s papers are not very quantitative, but other “dye therapy” researchers did large-scale comparisons of multiple colored antibiotics, at multiple concentrations, against multiple bacterial species.

On January 1, 1914, the Journal of Experimental Medicine published the Observations of Josephine S. Pratt and Charles Krumwiede Jr. (not to be confused with their Further Observations, published 4 months later). They established a method for testing large numbers of drug/bacteria combinations while minimizing the amount of agar needed, by putting two samples in each Petri dish, slanted away from each other. Here they describe the process in vague terms that would be better presented as a 5-minute video.
As a routine a batch of agar was selected which was found especially suitable for the more feebly growing [bacteria]. To the hot agar an appropriate volume of a watery solution of dye was added to give the final dilution desired. The same agar was used in each experiment.
The most convenient and economical method was found to be as follows. One unopened Petri dish was used to tilt up one side of a second dish. In the opposite side was poured just sufficient agar to give a satisfactory slant. This dish was covered and used to tilt up a third dish, and so on in a row. After the agar had set, slants were poured in the other side of the Petri dishes which were tilted in the reverse direction. In this way two mixtures of agar could be used in the same dish, very little agar being required for each slant.
After inoculating all these plates with bacteria, they used the eye test. Compared to a control plate with no dyestuffs, how much did the dye prevent the bacteria from growing after 18 to 24 hours? Not at all? Was it “restrained”? “Markedly restrained”? Completely eliminated?
Here’s Table 1.

That is a lot of information. 11 drugs, tested against 30 bacteria (12 Gram-positive and 18 Gram-negative), makes 330 combinations, of which only 7 potential tests were not performed. (I think the ellipsis means “not performed”.) Each of these 323 tests was done at 3 concentrations, making 969 data points in a single table.
To turn this into graphs would require many graphs. It would also require us to turn the X’s and +’s into a semiquantitative system (let’s say + = 4, ± = 3, X = 2, —* = 1, and — = 0). And since each data point is restricted to those 5 possibilities, you wouldn’t gain much by looking at a bunch of individual dots or bars anyway.
Let’s leave it as a table.
The main flaw of this table is that all the symbols look similar, except “—” . The bottom half of the table is a wall of symbols for different degrees of growth. It’s hard to see trends, because the symbols are hard to distinguish from each other, so it looks like every bacterium is resistant to every drug. Which is not quite true.
Instead of these text symbols, how about something that may be more intuitive — representing the 5 levels of growth as 5 colors. This may not be intuitive in every culture, and it may not work for the color-blind or in B&W printouts, but I took the liberty of changing the table. Now as bacteria proliferate, they pass from “no growth” (white) through yellow, green, and purple stages until they attain “growth like control” (charcoal grey). At first I wanted to range from white to black, but if the cells are black you couldn’t see the lines between them. Or maybe you can’t see them anyway.
For the tests that weren’t done, I replaced the ellipses with neutral grey. And finally, the two types of “diphtheroid bacilli” produced exactly the same results, so they were conflated into one.

So where does this data lead us? Krumwiede and Pratt draw limited conclusions. The tables speak for themselves. To briefly summarize their Summary section: the “streptococcus-pneumococcus group” is more dye-resistant, and the “dysentery bacillus group” is highly unpredictable with dye-resistance showing “no correlation with the common differential characteristics”. Also, they discovered mutations that make bacteria lose resistance. (“Among Gram-negative bacteria a strain is occasionally encountered which will not grow on violet agar, differentiating it from other members of the same species or variety.”) Finally, in the middle of the Summary section they say this.
The reaction is quantitative, although the quantitative character is more marked with some species than with others.
Now, a modern reviewer would look unkindly on that sort of admission. First, it seems like it’s not quantitative, it’s semiquantitative. Instead of measuring the number of colonies, you’re grading “growth” on a scale from 1 to 5. And which are the species that don’t have a “quantitative character”? Why don’t you use some other method to see how well those ones are growing? And by the way, how repeatable is your eye test? And what does it mean exactly? Let’s see examples of “growth like control”, “restrained growth”, and “markedly restrained growth”. Does it mean there were fewer colonies, or the colonies were smaller, or both? And why use the same 3 concentrations of all 11 drugs? Maybe 1:500,000,000 would have still killed the bacteria, and be less toxic to patients.
That’s what I’d say, if the journal hadn’t told me “Your review is now 100 years late and consequently is no longer needed.”
* * *
One more paper: from 7 years later, Gay and Morrison in the January 1921 Journal of Infectious Diseases. Whereas Krumwiede & Pratt (1914) was the first in their series, this is a sequel.

Krumwiede & Pratt took a limited range of dyes, and used then on every sort of bacteria they could find. Now Gay & Morrison use every dyestuff they can find on a limited range of bacteria. This is a much longer paper, so I’ll just address their first set of data, about bacterial growth in culture, and ignore their innovative rabbit empyema model.
Table 1:

In this table, the numbers mean the reciprocal of the minimum inhibitory concentration (MIC). The MIC is the smallest concentration of the drug that will prevent bacteria from growing. If the MIC is 5 ng/ml, the bacteria should grow if the concentration is lower than that, and the bacteria should die if the concentration is 5 mg/ml or greater.
“2,000” means a 1 to 20,000 dilution. I think that’s weight/volume (1 gram in 20,000 milliliters). The lower the number in this graph, the more concentrated the drug needs to be to kill bacteria. A drug marked “2,000” needs to be a thousand times more concentrated to have the same effect as a drug marked “2,000,000”.
This table is clear. Intuitively we look at the numbers and recognize that 2,000 is smaller than 20,000 and therefore represents less of a dilution. If they were in scientific notation, it wouldn’t be as intuitive.
The only problem is the use of “0”. The most concentrated dyes they used were at a 1:2,000 concentration. If the bacteria still grew, they listed this drug as “0”, or not active against the bacteria. Taken literally, “0” means Staphylococcus would grow on media consisting entirely of methylene green. I would just write the word “inactive” instead of the number 0.
* * *
I might also expand the table to include the rest of the 40 dye molecules Gay & Morrison used in this study. That’s right — in addition to the 12 molecules listed above, they have data on Acid fuchsin, Acid violet, Acridine orange, Azo-acid red, Basic fuchsin, Benzo-azurin, Brilliant cresyl blue, Columbia blue R, Congo red, Crystal ponceau, Cyanin B, Diamil blue, Erioglaucin A, Janus dark blue B, Methylene blue (medical purity), Methylene blue GG, Neutral red, New fast green 3B, Nile blue, Oxamin violet, Rhodulin violet, Safranin, Sauer grün, Scarlet 6R, Setocyanin, Sulphon acid blue R, Toluidin blue, and Wasser blau.
But most of the data is in paragraph form. And it’s not immediately clear.

Let’s make an expanded version of the table above, containing all the dyestuffs. Even the dyestuffs that never killed any of the bacteria. And make some other changes:
- Keep them arranged in order of effectiveness, but put the most effective ones at the top.
- In fact, divide them into categories. Those that inhibited all 3 bacterial species, those that inhibited 2, those that inhibited 1, and those that were completely ineffective.
- Update the nomenclature. We consider Bacillus typhosus to be Salmonella now.
- And… why not color-code the chart. Maybe blue dyes will do one thing, and red dyes will do something else. Might as well include that information. Patterns may emerge.
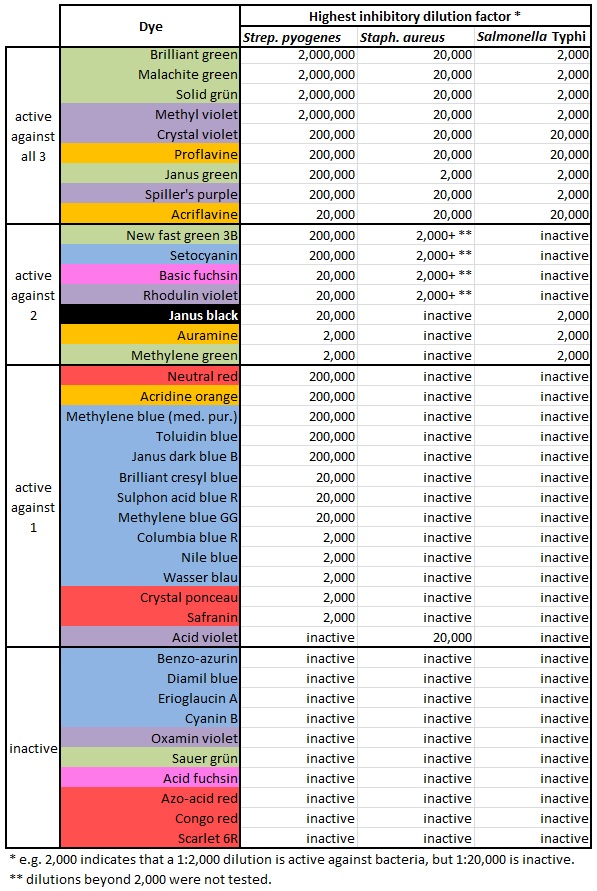
Isn’t it nice to see those colors? And it shows how much easier it is to kill Streptococcus pyogenes. There’s only one dye that kills either Staphylococcus or Salmonella but fails to kill S. pyogenes. And it shows that blue and red dyes aren’t very antibacterial, while green ones kill bugs dead. Why is that?


