Amboceptor

Microbiological, virological, bacteriological, immunological, medical, epidemiological, historical, anecdotal

Tag: Data Update

Data Update: Pox in rabbits, pox in mice

Here’s a paper by Frank Fenner (1914-2010), which compares quite a lot of different poxviruses to establish basic facts about their biology.

By 1958, when this was published, Fenner was already well known in Australia for his leadership role in releasing extremely deadly myxoma virus among the rabbit population. This was deemed to be worth the risk, as the creatures had for almost a century been locust-like in their consumption of Australia’s crops, only making themselves useful as a source of food during the Depression. In a prelude to fellow Australian Barry Marshall’s auto-experimentation with Helicobacter pylori, Fenner and two other experts infected themselves with myxoma to show that the risk to humanity was negligible.

Fenner F (1958). The biological characters of several strains of vaccinia, cowpox and rabbitpox virus. Virology 5(3):502-529. (abstract here: subscription required for full article)

This paper was an attempt to clear up the categorization of various poxvirus strains, mostly vaccinia virus. Fenner got colleagues around the world to provide samples of Mill Hill (V-MH), Williamsport (V-WILL), Pasteur Institute (V-PI), and other vaccinia isolates, which had been designated as either “dermal” or “neuro-” vaccinia based on whether they had been propagated in rabbit skin or rabbit brain. Were these categories practically useful? What strains of vaccinia, if any, were really typical of the virus?

The vaccinia strains were compared to the “Amsterdam” and “Brighton” variants of cowpox, and the “Utrecht” and “Rockefeller Institute” variants of rabbitpox. Rabbitpox is not the same as myxoma virus, by the way.

* * *
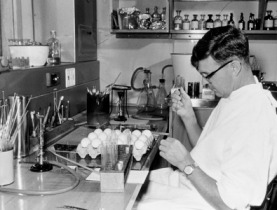
Frank Fenner inoculating eggs with virus in 1958. Source: Sydney Medical School

Frank Fenner infecting eggs. Source: Sydney Medical School

Also included in the comparison were “white variants” of certain virus strains. At this time culturing cell lines in vitro was not convenient. Lots of procedures, including growing virus, that we would now do with cellular monolayers in petri dishes were done in a system called the chorioallantoic membrane (CAM). The CAM is the membrane under the shell of an egg. Before doing any experiments on the various viruses, Fenner and associates made sure each virus was pure, by inoculating eggs and then extracting a single “pock” from the CAM for further propagation.

Often they would see that a virus that normally produced red, angry pocks had a few white pocks. Under further study, these “white variants” generally turned out to be milder than their parent strains, as a result of some genetic deletion. The white variants gave me some trouble in putting together the graphs based on Fenner’s data, because they are grouped with non-white strains that are far more virulent.
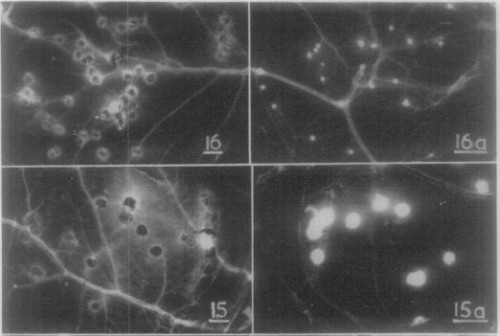
Sample chorioallantoic membrane pocks. 16a is the "white variant" of 16 (Rabbitpox Utrecht). 15a is the "white variant" of 15 (Cowpox Brighton).

Sample chorioallantoic membrane pocks. 16a is the “white variant” of 16 (Rabbitpox Utrecht). 15a is the “white variant” of 15 (Cowpox Brighton).

Let’s get to the data. After doing a bunch of CAM experiments, Fenner started infecting animals. He compared the viruses for their ability to kill mice and rabbits after brain infection, and induce skin lesions in rabbits after skin infection.

This table contains an immense amount of data, but it takes up two pages which is never a good thing. I think we can turn it into two good figures, one for mouse infection and one for rabbit infection.

fenner-table5

First of all, not all this data needs to be graphed. If you look at the last two columns, every rabbit skin lesion of more than 13 mm in diameter is considered “IPC”, and every smaller lesion is “N”. That’s all we need to know. Also, I don’t think it makes sense to list a mean survival time for experiments where almost every mouse survived. It’s a little sketchy to say that mice that never came close to dying had a “survival time” of 14 days, and then average that arbitrary number with actual survival times of mice that died. So I’ll drop the “mean survival time” data as well.

* * *

My mouse figure has two parts. I didn’t do any statistics on the data.

1A shows the relative virulence, which is a somewhat confusing metric that compares the LD50 (dose of virus at which half of infected animals die) with the virus’s ability to cause pocks on the egg membrane. All of the viruses grow pretty well in eggs, so this shows which viruses are particularly adapted to be dangerous to mice (or rabbits).

1B shows how many mice survived brain infection with each virus strain. Nowadays we would show survival curves for this – you know, the lines that always start out horizontal with 100% survival, and as the experiment goes on, the line goes down and down, stepwise, as mice succumb to mortality. But Fenner just shows the percent of mice that died during infection (probably this means the number that were dead after 14 days). I changed this to become a graph that shows the % of mice that survived infection.

Infect mice. (A)

Figure 1. Mice are more susceptible to neurovaccinia and rabbitpox than dermal vaccinia. (A) For each strain of virus, mice were infected intracranially with a range of doses, and the LD50 was calculated as the dose which was lethal to 50% of infected mice. LD50 values are normalized to the number of CAM pocks produced by the same dose of virus in eggs. Horizontal line represents the limit of detection. (B) For each strain of virus, mice were infected intracranially with 100,000 infectious particles. Here we show the percent of mice surviving to 14 days post-infection (sample size = 10). Bars with white stars represent “white variants”.

The rabbit figure has three parts.

2A is the relative virulence data again. This time it’s not the LD50, but the ID50. (Even though it says “LD50” in Fenner’s table, it says “ID50” in the legend and in the text.) “LD” means lethal dose, whereas “ID” means infectious dose. So this is the dose of virus at which half of infected animals show signs of infection. “Infection” in this case would be a skin lesion. He doesn’t say exactly how big a lesion needs to be before it’s considered “infection”.

2B is a similar graph showing the diameter of the lesions, in millimeters.

And then there’s a bunch of survival curves. 2D is too busy to be able to decipher each datapoint, with eight overlapping lines in a single graph, but what’s important is that there’s a huge difference between 2C and 2D.

rabbit

Figure 2. Rabbits are more susceptible to neurovaccinia and rabbitpox than dermal vaccinia. (A) For each strain of virus, rabbits were infected intradermally with a range of doses, and the ID50 was calculated as the dose which produced a lesion in 50% of infected mice. ID50 values are normalized as described in 1A. (B) For each strain of virus, rabbits were infected intradermally with 100,000 infectious particles. After 5 days of infection, the diameter of each skin lesion was measured with a ruler. (C-F) For each strain of virus, rabbits were infected intradermally with 100,000 infectious particles, and survival was monitored daily (sample size = 2-4).

What do you think? Let me know through email (see “About” page). Or through Twitter. Or subscribe via email or RSS (see bottom of this page). Or watch this German rap video.

Data Update: Typhoid ice cream

To this day, the safety of the ice cream supply is a field of inquiry among microbiologists, as can be seen in recent findings from Croatia (1), Zimbabwe (2) Argentina (3), and other places (4,5). Here in the U.S. there’s not as much concern; as far as I can tell the last outbreak of food poisoning caused by mass-produced ice cream in a rich Western country was in 1994 (6), when beloved Minnesota company Schwan’s Ice Cream was transporting ingredients in unsterilized egg tankers. Since then there have been outbreaks on farms, such as two big ones in Belgium and Wales. Most are like the Belgian case (7), which was blamed on ice cream produced right there on the farm, rather than industrially. The Welsh case (8) was blamed not so much on the ice cream itself, but on ice cream’s notorious ability to make children’s hands sticky, turning them into repositories for farm filth. A comparison between desserts in Houston and Guadalajara (9) suggests that the US is fortunate not to have this problem. But back in the 1910s and 1920s it was a different story.

Looking at old tables of contents from the Journal of Bacteriology, it’s striking how many articles are about milk. Even more than other food products, there was a need for science to improve the safety of milk, cream, cheese, etc. Pasteurization was established as useful in the late 19th century, but it would not become widespread until a 1913 typhoid epidemic in New York. This convinced local authorities that the improvement in public health outweighed people’s concerns about what boiling milk did to its taste and possibly its nutritional content (for more on this see Neatorama, “The Fight for Safe Milk”). But still, outside major urban centers where access to fresh milk was limited, people figured that raw milk was fine because the farms were nearby.

And ice cream was contaminated, too. By tuberculosis, typhoid, Bacillus coli, and others. But how big a problem was it, really? The bacteria wouldn’t multiply if they were frozen. But would they actually be killed?

The results on this were basically in by 1926, when Michigan State professor Frederick Fabian collected them in a great review in the American Journal of Public Health (10). Some excerpts:

The rapid rise of the ice cream industry and the general use of ice cream as a food in the past few years has added another item to the public health official’s responsibilities. If an epidemiologist had been tracing an epidemic a few years back, he could have practically left ice cream out of consideration. However, today it has become such a common article of diet that it should be taken into account in any work of this nature.

…Although there has been a vast amount of work done to show that pathogenic bacteria are not readily killed by freezing, yet, due to the nature of the product ice cream has not always been considered a serious source of bacterial infection. This view is held especially among laymen and those not familiar with the facts.

…To test out the extreme temperature which pathogenic bacteria could withstand Macfayden and Rowland (11) subjected the same organisms to the temperature of liquid hydrogen (-252° C.) for 10 hours without any appreciable effect on them. A great deal of work has been done also to show that pathogenic bacteria live for a considerable length of time in ice and a great many epidemics have been traced to this source.

…In practically every city of any size today pasteurization of the milk supply is required by ordinance. The time and temperature are also pretty well established. There are not many such ordinances or laws pertaining to ice cream in most cities or states. …Many of the old experienced producers from their experience with milk have the good judgment to pasteurize the ice cream mix. However, the unscrupulous and the ignorant are allowed to do as they please.

In short, by 1926 public health authorities have got a handle on milk contamination, but for the very reason that ice cream seems safer (nothing can grow in it! most of the time), it has not been regulated and may now be more of a risk than milk.

Along the way, Fabian lists all known ice cream-associated outbreaks, and describes the experimental evidence for bacterial survival in frozen ice- and cream-like substances. Let’s clarify those results, now that we have the ability to make graphs.

* * *

Four experimental papers are mentioned. Mitchell 1915 (12), Bolten 1918 (13), and Prucha and Bannon 1926 (14) use Salmonella Typhi (or “Bacillus typhosus“, or “Bacterium typhosum“). Davis 1914 (15) uses hemolytic Streptococcus. I found two later papers in the Journal of Dairy Science by G. I. Wallace of the University of Illinois, but as he himself seems to think his results are unimportant, we won’t bother with them.

G. I. Wallace (1938) is not exactly making a big effort to inflate the importance of his results here, is he?

G. I. Wallace (1938) is not trying very hard to inflate the importance of his results.

O. W. H. Mitchell (1915) doesn’t even have a table in his paper. He describes six experiments which involved similar ice cream preparation and storage, but with different ingredients. For each experiment, he introduced some typhoid bacilli to the ice cream mixture, checked after 24 hours of freezing to see how much bacteria there was, and continued measuring until “the last positive examination” for typhoid bacilli. This seems like a badly-controlled series of experiments, since the amount of bacteria introduced into the cultures varies widely between experiments, and I can’t tell the difference between Experiment 1 and Experiment 2. Apparently in Experiment 2, “Ice cream made with 1 pint of thin cream, one-half cup of sugar and 1 tablespoonful of vanilla was treated similarly to the ice cream in Experiment 1.” But… all three of those ingredients are also in Experiment 1. Because of the order things are listed in, my guess is that Experiment 2 has an extra 1/2 cup of sugar.

Also the description of “Flake” powder does not enable colleagues to easily replicate the experiment.

Flake is a powder prepared by the Murray Company, 224 State Street, Boston. According to a circular accompanying the powder, the preparation “is a pure, wholesome powder, which can always be relied on, and is essential in making an exquisitely smooth ice cream.”

That doesn’t help. Anyway, the jumble of descriptive paragraphs can be entirely summed up in this table.

ice-cream-mitchell-1915-table

O. W. H. Mitchell’s 1915 data, presented in no particular order

Guess what! That tells us nothing. Pasteurization didn’t help; adding gelatin made things worse somehow; and extra sugar led to less bacteria at the late timepoint. Also, there’s no more bacteria after a couple weeks than there was at 24 hours, even though “After a few days [the samples] began to lose their sweetness of odor, and at the time of the last examinations they gave off mildly unpleasant odors.”

Yes, this was while frozen. They were only slightly below freezing (-3° to -4° Centigrade). Sample size is 1. Total waste of time, I say with 98 years of hindsight.

* * *

Let’s move on to Bolten (1918). He looks at both typhoid and diphtheria bacilli. He shows even less data than Mitchell, but at least the experiments make sense. Basically, small containers of frozen cream (not ice cream, I guess there was no sugar or vanilla) had been inoculated with a growing culture of typhoid, at a 10:1 ratio of cream to bacterial broth, and “immediately placed in a brine tank”. They were “partly melted” daily, and a sample was taken to see how many typhoid bacteria were growing. You’d think that one of the advantages of ice cream as an experimental system is that you don’t have to thaw it in order to take a sample. But that was their procedure.

According to more than one article in the Jan-June 1904 issue of Ice and Refrigeration Illustrated (mental note: look for blog topics in Ice and Refrigeration Illustrated), a “brine tank” typically froze things to between 8 and 16 degrees Fahrenheit (-13° to -9°C). So, quite a bit colder than the ice cream in Mitchell’s study. This type of freezing is pretty good at killing bacteria, given that they started with a substance that was fully 10% bacterial broth. After 2 weeks they had a 50% reduction in colonies; after 4 weeks they had a 95% reduction; and after 10 weeks two of the four containers had no detectable germs at all. Maybe it’s not so much the low temperature as the daily freeze-thaw cycle killing the bacteria.

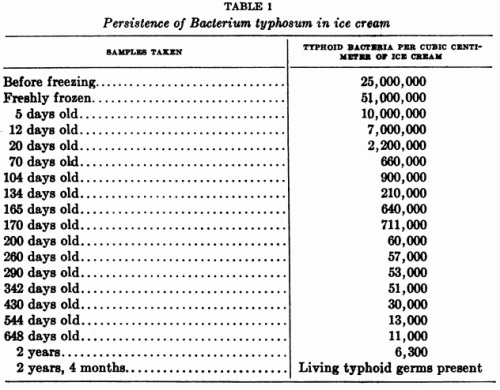
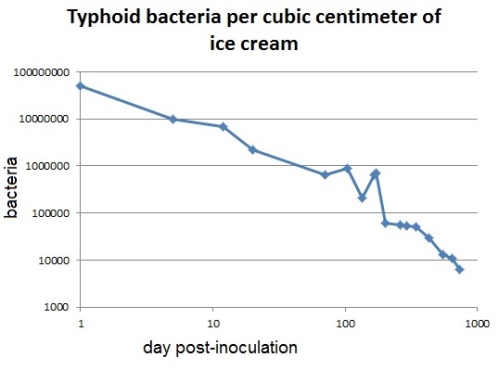
Skipping gracefully over the diphtheria portion of the paper (which is more confusing), our last entry on ice cream typhoid is the most data-intensive, by Prucha and Brannon of the University of Illinois in the relatively rigorous Journal of Bacteriology. (The other two are in medical journals… who cares about lab experiments in those?) They standardize their experiments by mixing bacteria with ice cream mix, incubating, and freezing it when it gets to 25 million bacteria per cubic centimeter. They keep it in a “hardening room” which fluctuates between -8° and 8°F (-22° to -13°C) – the coldest freezing conditions we’ve seen so far. They take samples not every day, but at increasingly sparse intervals – and they actually show us their data in a table. Which can easily be turned into a graph.

prucha-brannon-table

I should use the word “germs” more often in writing about these things. I forget about the word “germs”.

A summary:

prucha-brannon-graph

Here we see something much closer to Bolten’s “bacteria are mostly killed by freezing”, rather than Mitchell’s “bacteria keep growing in the cold”. And this wasn’t with constant refreezing and rethawing, either. Just low temperatures.

You may notice that the number increases 3-fold between day 134 and 165. Well, they explain that too.

It will be observed in table 1 that the samples taken when the ice cream had been in storage for 165 days gave higher counts than the previous samples. To check this point, another set of samples was taken five days later which again gave similar counts. An inquiry brought out the fact that one of the attendants had removed the experimental ice-cream a few days before to an adjoining room for an hour and one-half. This room had a temperature of 40°F. The ice cream did not melt. Whether there was any multiplication of the germs at this time could be determined.

The conversation that led to that passage:

Prucha: What happened here?

Brannon: I looked into that. You won’t believe it. One of the fellows in the dairy husbandry program, who we told to keep an eye on the freezer…

Prucha: Yes?

Brannon: Well, some of his fraternity brothers let him know it would be a great joke to take the experimental ice-cream into the common room and start eating it.

Prucha: Oh, goodness. Doesn’t he know we put typhoid in it?

Brannon: I think we were a little too excited when we found out freezing had reduced the germs by 99%.

Prucha: So did it melt? Is that why the numbers are high?

Brannon: Luther says he told the boob to put it back in the freezer before it got soft. It was out for maybe 90 minutes.

Prucha: Undergraduates! Damned impudent wastrels!

Brannon: Do we really need “attendants” for this experiment at all?

* * *

1. Mulić R et al (2004). Some epidemiological characteristics of foodborne intoxications in Croatia during the 1992-2001 period. Acta Med Croatica 58:421-427.

2. Igumbor EO et al (2000). Bacteriological examination of milk and milk products sold in Harare. Afr J Health Sci 7:126-131.

3. Di Pietro S et al (2004). Surveillance of foodborne diseases in the province of Rio Negro, Argentina, 1993-2001. Medicina [B Aires] 64:120-124.

4. Gücükoğlu A et al (2012). Detection of enterotoxigenic Staphylococcus aureus in raw milk and dairy products by multiplex PCR.
J Food Sci 77:M620-623.

5. el-Sherbini M et al (1999). Isolation of Yersinia enterocolitica from cases of acute appendicitis and ice-cream. East Mediterr Health J 5:130-135.

6. Hennessy TW et al (1996). A national outbreak of Salmonella enteritidis infections from ice cream. N Engl J Med 334:1281-1286.

7. De Schrijver K et al (2008). Outbreak of verocytotoxin-producing E. coli O145 and O26 infections associated with the consumption of ice cream produced at a farm, Belgium, 2007. Euro Surveill 13:8041.

8. Payne CJ et al (2003). Vero cytotoxin-producing Escherichia coli O157 gastroenteritis in farm visitors, North Wales. Emerg Infect Dis 9:526-530.

9. Virgil KJ et al (2009). Coliform and Escherichia coli contamination of desserts served in public restaurants from Guadalajara, Mexico, and Houston, Texas. Am J Trop Med Hyg 80:606-608.

10. Fabian FW (1926). Ice cream as a cause of epidemics. Am J Public Health (N Y) 16:873-879.

11. Macfayden A & Rowland S (1900). A further note on the influence of the temperature of liquid hydrogen on bacteria. Lancet 156:254-255.

12. Mitchell OWH (1915). Viability of Bacillus typhosus in ice cream. JAMA LXV:1795-1797.

13. Bolton J (1918). Effect of freezing on the organisms of typhoid fever and diphtheria. Pub Health Rep 33:163-166.

14. Prucha MJ, Brannon JM (1926). Viability of Bacterium typhosum in ice cream. J Bacteriol 11:27-29.

15. Davis DJ (1914). The growth and viability of streptococci of bovine and human origin in milk and milk products. J Inf Dis 15:378-388.

Data update: Bacterial growth on tellurite

If you’ve read Ruth Gilbert and E.M. Humphreys (1926), The use of potassium tellurite in differential media (J. Bacteriol. 11(2):141-151) recently, you’ve probably noticed that the bacterial nomenclature is out of date and it’s hard to tell which species they’re talking about. The descriptions of colony morphology don’t help much, as they only tell us what the colonies look like on beef infusion agar with 5% horse serum and 1/34,000 tellurium content. So here we present the first in what may be a series, of ancient data updated for the modern reader.

Table 2

This table is clear and concise. I would not have made the text in the headers smaller than the text in the columns, and the spacing/justification is inconsistent, but it tells us a lot. Fungi (ActinomycesAspergillusSaccharomyces) had no trouble growing on tellurified plates, but both bacilli and cocci showed the full range between being unaffected and being totally wiped out.

However, the viewer used to modern bacterial nomenclature is perplexed. Some amendments to the names of these organisms have been made over the years. I was able to figure out what all of them are called nowadays, except “Bacillus pestis caviae” (probably some sort of Salmonella) and the Mt. Desert thing (probably a strain of Shigella). And I can’t get to square one of figuring out what “Type I, Type II and Type III” Pneumococcus correspond to today. That way lies madness.

The table has been amended using the modern graphical presentation package MS Paint, which was not available until almost sixty years after this paper was published (1985).

Table 2.0.1

To summarize:

  • 3 out of 3 fungal species are unchanged.
  • 3 out of 53 bacterial species/subspecies are unchanged. Only Bacillus anthracis, Bacillus subtilis, and Staphylococcus aureus. Bacillus proteus vulgaris is almost the same, with Bacillus removed and the remaining, oddly medieval name intact. Pneumococcus is still pneumococcus.
  • Every bacillus really used to be called Bacillus, didn’t it?
  • The only instance of “lumping” rather than “splitting” genera I see is moving Sarcina in with Micrococcus.
  • Meanwhile, most of the Micrococcus species were split into different genera, and what was once called Micrococcus tetragenus based on its  tetrad morphology is now close to being synonymous with the genus Micrococcus as a whole.
  • “Pestis caviae” means “plague of guinea pigs”. I’ve seen one reference to Bacillus pestis-caviae being the same as Bacillus typhimurium, and one reference to it being the same as Bacillus aertrycke, which seems to in turn be the same thing as Bacillus suipestifer. I can’t quite tell what the difference is between Bacillus suipestifer and Bacillus choleraesuis is either, as both are described (etymologically as well) as the agent that causes hog cholera. All of these were at one point designated as part of the “Paratyphoid B” group of bacilli, which were then renamed Salmonella. And then a bunch of others were moved into Salmonella, and then it was determined that basically all Salmonella were in the same species and subspecies, and could only be classified as “serovars” of S. enterica enterica. So who knows.
  • As it was then, this remains a list of the most significant human pathogens. Plus some that affect farm animals, and two that look cool (P. fluorescens and C. violaceum).
  • The veil of history is drawn back, and patterns emerge. We can now tell that Corynebacterium species are not inhibited by tellurium, and Clostridium are very inhibited. And Klebsiella and Salmonella are in the middle.
  • In fact… how about a new table?

Table 2.1

Journal of Bacteriology, issue 11 (February 1926), is available here.